
On this page
You sent a survey to 500 people and 120 answered. Is that good? Before you can say, you need to know what the number means. A survey response rate looks simple, but the answer changes with what you count as "sent" and what you count as "answered".
This guide shows you how to calculate a survey response rate, which denominator to use, and how survey researchers define it. You'll also see what research says about a good rate (less than you'd hope) and 12 ways to raise yours. At the end there's a free calculator that works out your rates for each wave or channel and plans your reminder dates.
How to calculate survey response rate: the formula#
Here is the survey response rate formula in its plainest form:
Response rate = completed responses / eligible people you invited
The top of the fraction is easy: people who finished. The bottom is where the arguments start. Three choices change the result:
- Bounced invitations. If 20 emails never arrived, do they stay in the count?
- People you should not have asked. Someone who left the club last year is not a nonresponder. Take them out.
- Half-finished answers. Someone who answered three questions out of ten is not a completed response in the strict version.
Take the first worked example from the calculator. You invite 500 customers. 20 emails bounce, and 5 people turn out to be outside the group you meant to survey. 160 people start the form and 120 finish.
| Denominator | Sum | Survey response rate |
|---|---|---|
| Eligible invited (bounces kept in) | 120 / (500 - 5) = 120 / 495 | 24.2% |
| Eligible delivered (bounces left out) | 120 / (500 - 20 - 5) = 120 / 475 | 25.3% |
One survey, two honest answers. So whenever you report a rate, write the denominator next to it: "120 completed of 495 eligible people invited (24.2%)."
Working backwards is useful too. If our survey sample size guide says you need 200 completed answers and you expect about a quarter of people to respond, you need to invite about 800. The expected rate is your own guess from past surveys, not a rule.
AAPOR's standard definitions in plain words#
The American Association for Public Opinion Research (AAPOR) publishes a standard for this: Standard Definitions: Final Dispositions of Case Codes and Outcome Rates for Surveys, 10th edition (2023). It starts the rates chapter with a rule worth copying: "a statement that 'the response rate is X' is unacceptable. One must report exactly which rate was used" (AAPOR Standard Definitions, 10th edition, PDF, accessed 28 October 2026).
AAPOR defines six response rates. The ones you need to know:
- RR1, the minimum response rate. In AAPOR's words, it "is the number of complete interviews divided by the number of interviews (complete plus partial) plus the number of non-interviews (refusal and break-off plus non-contacts plus others) plus all cases of unknown eligibility". Plain version: completed answers divided by everyone who might have been eligible, including people you never heard back from at all.
- RR2 is the same, but partial answers count as responses.
- RR3 estimates how many of the unknown cases were really eligible. AAPOR says it "can be considered the most-common AAPOR response rate in reporting", and you must explain how you made the estimate.
- RR5 and RR6 assume none of the unknown cases were eligible. AAPOR calls them "only appropriate when it is valid to assume that none of the unknown cases are eligible or when there are no unknown cases."
What about bounced emails? AAPOR's guidance on email surveys says people change addresses often, so "one cannot simply assume that such cases are ineligible. Thus, an undelivered email message essentially would place such cases in the unknown eligibility category." That's why the calculator's main rate keeps bounces in the denominator, like RR1. Leaving them out is closer to the RR5 assumption, so label it if you use it.
AAPOR also defines a completed answer before partials. One of its examples counts a complete as "More than 80% of questions answered" and a partial as "50%-80% of questions answered". Pick your own rule before the survey starts, and stick to it.
Good to know: a link posted on social media or a QR code on a poster has no list of invited people. That makes it an open, non-probability sample, and AAPOR says of non-probability online samples: "for many of these surveys, the denominator is unknown, making the calculation of response rates impossible." Track views, starts and completions instead.
If the difference between a survey and a questionnaire trips you up in a write-up, our post on survey vs questionnaire sorts out the terms.
Completion rate vs response rate#
These two get mixed up all the time, and they answer different questions.
| Rate | Formula | What it tells you |
|---|---|---|
| Response rate | Completed / eligible invited | How well the invitation worked |
| Completion rate | Completed / started | How well the form itself worked |
| Views to completions | Completed / people who opened the form | How a public link or QR code performs |
A low response rate with a high completion rate means people who open the form finish it, but too few open it. Work on the invitation, the timing and the reminders. A decent response rate with a low completion rate means the form loses people partway. Work on length, question order and hard questions.
Completion rate is not one of AAPOR's rates. It's still the most useful number for fixing the form, because it isolates the part you built.
What is a good response rate for a survey?#
This is the most searched question on the topic, and the honest answer is: it depends, and nobody has found a fair cut-off.
The best single figure comes from a 2022 meta-analysis by Meng-Jia Wu, Kelly Zhao and Francisca Fils-Aime. They "screened 8672 studies, and examined 1071 online survey response rates reported in education-related research". Their headline: "The average online survey response rate is 44.1%." (Wu, Zhao and Fils-Aime, Computers in Human Behavior Reports, 2022, abstract on DOAJ, accessed 28 October 2026).
Treat that as a reference point, not a target. It comes from published education research, not from customer or member surveys, so your own audience may behave quite differently.
A rapid literature review from the Clearinghouse for Military Family Readiness at Penn State reached the same place from another angle: "we could not find an agreed upon minimum standard for survey response rates." Its conclusion adds that "low survey response rates do not necessarily invalidate the survey" (Survey Response Rates: Rapid Literature Review, Penn State, 2019, PDF, accessed 28 October 2026).
Why can't anyone name one good number? A good response rate for a survey depends on:
- Who you ask. Your own members or class answer more than strangers.
- How you ask. Email, a QR code at an event and a link in a newsletter all behave differently.
- How you count. RR1 and a delivered-only rate can differ by several points on the same survey.
- What you need the answers for. A rough read of customer mood needs less than an estimate for a grant report.
And a higher rate is not always more accurate. Hendra and Hill studied 16 identical surveys fielded to 12,000 people and found "scant relationship between survey nonresponse bias and response rates" (Hendra and Hill, Evaluation Review, 2019, abstract on PubMed, accessed 28 October 2026). What matters more is whether the people who answered look like the people who didn't. Compare the two groups on anything you already know, like region or membership type.
12 ways to increase survey response rate#
Most of the evidence below comes from a Cochrane systematic review of randomised trials: Edwards and colleagues, "Methods to increase response to postal and electronic questionnaires" (2023 update, abstract on PubMed, accessed 28 October 2026). It reports odds ratios. An odds ratio of 1.5 means the odds of getting a response were about one and a half times as high with the method as without it. The review also notes "substantial heterogeneity amongst trial results in half of the strategies", so results vary from study to study.
- Survey the right people. Wu and colleagues found that "sending an online survey to more participants did not generate a higher response rate. Instead, sending surveys to a clearly defined and refined population positively impacts the online survey response rate." Clean your list before you send.
- Keep it short. Cochrane found the odds of response "increased by half" when "using shorter e-questionnaires (OR 1.51...)". Cut every question you won't act on. Our questionnaire guide helps you decide what stays.
- Write a short invitation. For electronic questionnaires, the odds of response tripled when "using a brief letter rather than a detailed letter (OR 3.26...)". Say who you are, why it matters and how long it takes. Stop there.
- Keep "survey" out of the subject line. The same review found the odds "were reduced when 'Survey' was mentioned in the e-mail subject (OR 0.81...)". Try "Two minutes on last week's workshop?" instead.
- Say why it matters. Response rose with "a more interesting topic (OR 1.85...)" and "when stressing the benefits to society of response (OR 1.38...)". Tell people what you'll change based on their answers.
- Offer the results. Offering the results "as an incentive" raised the odds by about a third (OR 1.36). Promise a short summary, and send it.
- Start with one easy question. A first screen with a single quick question gets people moving. HornetForms has a "One question at a time" layout on every plan, so each question gets the full screen.
- Show the way to the end. Split a longer form into pages, and HornetForms shows a progress bar, so people can see how much is left.
- Give a deadline, with a real close date. Cochrane found response rose when "giving a deadline (OR 1.18...)". Put the date in the invitation, then set the form's close date to match. The close date takes a date and a time, so "closes Friday at 5pm" means exactly that.
- Send reminders yourself. Penn State's review lists "providing multiple contacts" among the main ways to raise response. Wu and colleagues found that "using phone calls to remind participants about the online survey could also yield a higher response rate." Reminders are your own emails, texts or calls, so you choose who gets them and when. The calculator's Reminder plan tab works out the dates from your send date and the gaps you pick. Send them only to people who haven't answered.
- Put a QR code where people already are. At a class, an event or a front desk, a QR code on a slide or a printed card turns waiting time into answers. Every HornetForms form has a QR code (PNG and SVG) on the Share tab. Our RSVP QR code post covers printing and testing it.
- Prefill what you already know. If you know a member's email or plan, put it in the link so they don't type it again. HornetForms supports URL prefill for visible questions and hidden fields for things like the wave or channel, such as
?wave=2or?source=newsletter. Our guide to capturing UTM parameters in forms shows how hidden fields carry a source into every response. You can also send an email survey with answer links, so the form opens with the rating already picked.
What about incentives? Cochrane found monetary incentives almost doubled the odds of response for electronic questionnaires (OR 1.88). Wu and colleagues found that "the use of incentives did not show a significant impact on the response rate of online surveys" in published education studies. So the evidence is mixed, and the rest of the list costs nothing.
Not sure what to ask in the first place? See our guide on how to write survey questions. If it's a recommend question, the NPS calculation guide covers scoring. Still looking for a topic? Browse our survey ideas.
Track your survey response rate with the free calculator#
The free survey response rate calculator (Excel) does the sums for you, and it opens in Google Sheets too. Type one row per wave of new invitations or per channel: invited, bounced, known not eligible, started (optional) and completed.
For each row and for all rows together, it works out:
- Response rate, completed / eligible invited. Bounces stay in, the closest match to AAPOR's RR1.
- Response rate, completed / eligible delivered. Bounces left out, for comparison.
- Completion rate, completed / started. Blank when you don't know how many started.
- A Check column. It flags rows where the numbers can't be right: more completed than started, numbers pasted as text, negative numbers, or bounced plus not eligible adding up to everyone invited. Flagged rows stay out of the totals.
The Reminder plan tab takes your send date, your close date and the number of days you want between messages. It works out each reminder's date and day, and it flags reminders that land on a weekend or after the form closes. The example gaps of 4 and 7 days only show how it works. No study fixes the right gaps for your audience.
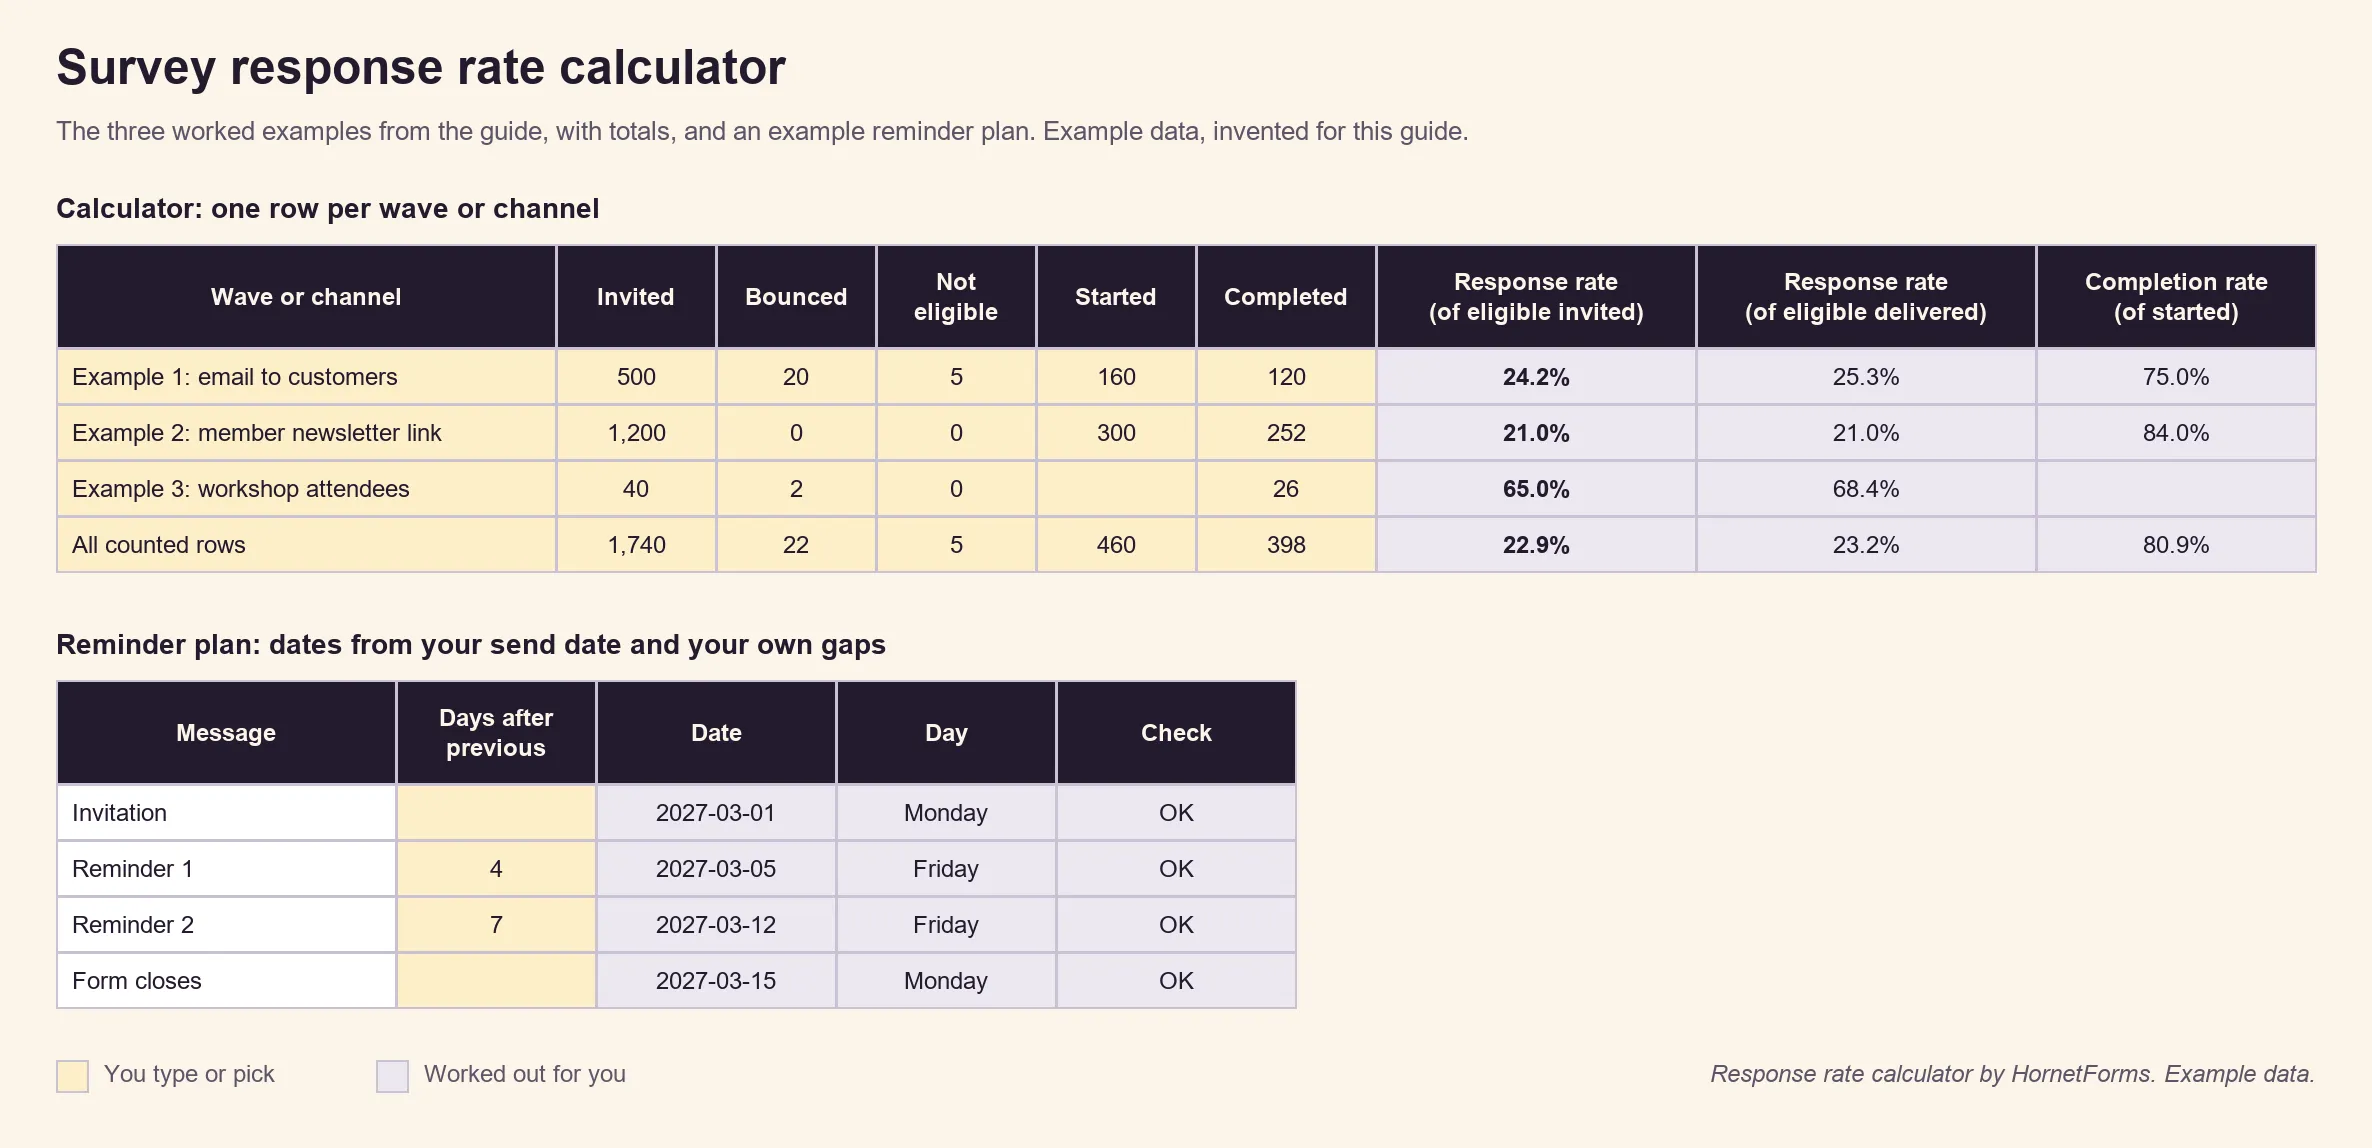
Example data only, invented for this guide.
Look at the workshop row. With only 40 people invited, one more answer moves the rate by 2.5 points, so don't read much into small swings. The total completion rate (80.9%) uses only the rows where you know how many started. There's also a CSV of the input columns if you'd rather build your own version.
Where do the numbers come from? In HornetForms, the built-in analytics show views, starts and completions for each form, so you can copy started and completed straight across. They also show approximate drop-off: the last question a visitor touched, so you can see roughly where people stop. If one question keeps losing people, rewrite it or move it later. Tag each channel's link with UTM parameters, and the built-in analytics show views and completions for each source.
Once the answers are in, our guide on how to analyze survey data takes you from the export to a one-page report. And a short, optional set of demographic survey questions at the end lets you compare who answered with who you invited.
Raise your survey response rate on your next form#
Pick your denominator before you send, and write it down. Keep the form short, give a real close date and plan your own reminders. Then read the completion rate and the drop-off to fix the form for next time.
HornetForms gives you unlimited responses within fair use on every plan, including the Free plan, so a survey that does better than expected doesn't hit a wall. Read what happens when a form hits its response limit on other tools. You can still set your own response limit when you need a cap, like a workshop with 30 seats, and the form closes itself when it's full. You can also turn on an email to yourself for each new response. See the features page for the rest. Sign up for free and send your next survey this week.