
On this page
The survey closed. You have a spreadsheet with a few hundred rows, a dozen columns and one question from your boss: "So what did people say?" This guide shows you how to analyze survey data in Excel or Google Sheets, from the raw export to a one-page report someone will actually read.
You don't need statistics software. You need counts, percentages, a comparison between groups, a score for each rating question and coded comments. Each step comes with the exact formula. There's also a free survey analysis workbook that does all of it once you paste your export, and a one-page survey results report template to share what you found.
How to analyze survey data: the short version#
Here's the whole process in eight steps. The rest of this guide walks through each one.
- Export your responses as a CSV or Excel file, or work from a live Google Sheet.
- Clean the data. Remove tests and duplicates, and decide what a blank means.
- Count and percentage each question. Use the people who answered as the base.
- Cross-tab by group. Compare answers across age bands, plans, teams or how long people have been customers.
- Score your scales. Mean, top-two box and, for 0 to 10 questions, NPS.
- Code the open-ended answers into themes, then count the themes.
- Chart it. One chart per finding, with a title that says the finding.
- Write a one-page survey results report: what you asked, who answered, what you found and what happens next.
The University of Kansas Community Tool Box, a free public guide to community research, describes the same core moves. It lists "calculating descriptive statistics such as the mean, median, mode, percentages, rates, or other relevant measures" and "coding qualitative information by identifying categories, concepts, themes, or other features that make the information easier to organize and analyze" (Community Tool Box, Chapter 37, Section 5: Collecting and Analyzing Data, University of Kansas, accessed 28 October 2026).
Haven't sent the survey yet? Check how many answers you need first, so you know how far your numbers can stretch.
Export your responses#
To analyze survey data in Excel or Google Sheets, first get it into a sheet. HornetForms gives you three ways:
- CSV export, on every plan. Download it from the form's Responses page. Excel and Google Sheets both open it.
- Excel export, on Pro and Business. The same columns as an .xlsx file, with "(UTC)" added to the two time column names. See the pricing page for plans.
- Google Sheets, on every plan. Connect the integration and every completed response lands as a new row while the survey is open. Our tour of where your form responses can go shows how to set it up.
The CSV has one row per response and one column per question. It starts with Response ID, Submitted at and Started at, then your questions in form order, and ends with Form version. The time columns use a standard format like 2027-01-01T15:10:40.000Z (UTC). Checkbox answers sit in one cell, joined with a comma and a space: Online orders, Home delivery. That detail matters when you count them.
The Google Sheets layout skips Started at and Form version, and adds a Response link at the end. The free workbook finds columns by header name, so both work.
To open a CSV in Google Sheets, use File, then Import, then upload the file. Google's help page on importing data sets lists the options, including "Insert new sheets" to add it as a new tab (accessed 28 October 2026).
Good to know: you can filter before you export. Build up to 10 conditions on any question in the responses table, like "How long have you been a customer? is Less than a year", and the CSV and Excel exports keep only the matching rows.
Clean the data#
Ten minutes of cleaning saves you from a report you have to take back. Before you analyze survey data, work on a copy of the export and check:
- Test responses. Delete the rows your team sent while building the form.
- Duplicates. If you asked for an email, sort by it and look for the same person twice.
- Answers out of range. A 7 on a 1 to 5 scale is a typo. The workbook ignores numbers outside the scale you set.
- Blanks. A blank isn't a zero. Leave it blank, and report how many people skipped each question.
- Write-in "Other" answers. Group the ones that mean the same thing ("Insta", "Instagram", "IG") so they count together.
Write down every change, so "why did the total drop?" has an answer.
Count and percentage each question#
This is the backbone of how to analyze survey data. For every closed question, count how many people picked each answer, then turn the counts into percentages.
In our example (a made-up customer survey with 24 responses), the answers to "How did you hear about us?" sit in column D. One count per answer:
=COUNTIF(D2:D200,"Friend or colleague")
=COUNTA(D2:D200)
=COUNTIF(D2:D200,"Friend or colleague")/COUNTA(D2:D200)
The first line counts one answer. The second counts everyone who answered. The third gives the share. COUNTIF works the same way in Excel and Google Sheets (both help pages accessed 28 October 2026).
Use the people who answered as the base, not every response. In the example, 23 of 24 people answered the question and one skipped it. "Friend or colleague" got 7 answers, which is 30.4% of the 23 who answered. Report the skip on its own line.
How to analyze survey data with multiple responses#
Because one checkbox cell holds several answers, an exact match misses people who picked more than one. Use a wildcard instead. Microsoft's help page says it plainly: "An asterisk matches any sequence of characters."
=COUNTIF(G2:G200,"*Home delivery*")
Two things to watch. First, the shares can add up to more than 100%, because one person can pick three things. Say so under the table. Second, a wildcard can catch the wrong answer when one option sits inside another, like "Delivery" and "Home delivery". The free workbook avoids that by matching whole options between the commas. In the example, 13 of 24 people (54.2%) picked "Online orders" and 8 (33.3%) picked "Home delivery".
A pivot table (Insert, then PivotTable in Excel; Insert, then Pivot table in Google Sheets) does the same counts with clicks. Microsoft calls it a tool to "calculate, summarize, and analyze data" (Create a PivotTable, Microsoft Support; Create and use pivot tables, Google Docs Editors Help; both accessed 28 October 2026). Pivot tables don't split checkbox cells, though, so use the wildcard for those.
Cross-tab by group#
Totals tell you what people said. A cross-tab tells you who said it, and it's where most people who analyze survey data find their best story. Put one question down the side, a group question across the top, and count each pair. Good demographic survey questions give you clean groups to compare.
COUNTIFS takes two conditions at once. Microsoft's help page says it "applies criteria to cells across multiple ranges and counts the number of times all criteria are met" (COUNTIFS function, Microsoft Support, accessed 28 October 2026). Google Sheets has it too. Here, column E holds "How long have you been a customer?":
=COUNTIFS(E2:E200,"Less than a year",G2:G200,"*Online orders*")
Then divide each count by the size of its group. Groups are almost never the same size, so compare shares, not counts.
In the example, 7 of the 9 newer customers (77.8%) order online, against 2 of 8 people who have been customers for one to three years (25.0%). That's a finding worth a sentence. But look at the group sizes: with 8 people, one person is 12.5 points. The Community Tool Box puts it this way: "Statistical significance should not be confused with practical importance, the size of an effect, or the percentage of participants who benefited." Report the group size next to every share, and treat small groups as a hint, not proof.
Score scales: mean, top-two box and NPS#
Rating and linear scale questions give you numbers to average. But the mean alone hides a lot, so report three things:
- Mean.
=AVERAGE(F2:F200)skips blanks for you. - Top-two box. The share who picked the two highest points:
=COUNTIF(F2:F200,">=4")/COUNT(F2:F200)on a 1 to 5 scale. - Bottom-two box. The share at the low end:
=COUNTIF(F2:F200,"<=2")/COUNT(F2:F200).
In the example, "Overall, how satisfied are you with us?" has a mean of 3.83 from 23 answers. Top-two box is 69.6% and bottom-two box is 13.0%. Split by group, the longest-standing customers have a healthy top-two box of 71.4%, but also the biggest unhappy group: 2 of 7 (28.6%) picked 1 or 2. Their mean of 3.71 looks almost the same as everyone else's. The boxes show the split the mean hides.
For agree and disagree grids, our Likert scale survey guide covers label sets, reverse scoring and a calculator. For a 0 to 10 "how likely are you to recommend" question, the scoring is different: see how to calculate NPS for the formula and worked examples.
Code open-ended answers#
The numbers tell you what is happening. The comments tell you why. Coding turns comments into something you can count:
- Read 20 or 30 answers before you name anything.
- Write a short list of codes, five to ten themes like "Delivery speed" or "Prices and fees". Add "Other" and "No change needed".
- Give each answer one code, or two if it makes two separate points.
- Count the codes and work out each one's share of the answers.
- Pick a short quote for each top theme. It makes the report land.
The Community Tool Box backs this up: "When useful and appropriate, summarize qualitative information quantitatively. This might include counting how often particular themes, experiences, or barriers are mentioned."
In the example, 18 people answered "What is one thing we could do better?". Delivery speed came up in 4 answers (22.2%), and five other themes came up 3 times each. One answer ("Show stock levels on the website") got two codes, so the shares add up to more than 100%.
Chart it#
Most survey results need only two kinds of chart:
- A bar chart for counts and shares of one question. Sort the bars from biggest to smallest, unless the answers have a natural order.
- A column chart for a scale, with one bar per point, in order. It shows a split room at a glance.
Give every chart a title that says the finding, not the question. "Newer customers order online more often" beats "Q4 by tenure". Put the number of answers under it, and skip 3D effects.
The free survey analysis workbook#
If you'd rather not build all this yourself, the survey analysis workbook (Excel) is how to analyze survey data in one file. Paste your HornetForms CSV export on the Responses tab, type the names of the questions you want to look at, and it fills in:
- Counts: up to three questions, with counts, shares and blanks. A Yes or No switch handles checkbox questions.
- Cross-tab: one question by a group question, as counts and as the share of each group.
- Scale score: the count for each point, plus mean, top box, bottom box and net score, for everyone and for each group.
- Open answers: each comment listed with two code columns and a running count for each code.
- Two charts: a bar chart for the first question and a column chart for the scale.
It ships with 24 example responses, and a red line reminds you to clear them first. The paste area runs from column A to Z, which fits about 22 questions. For a longer survey, delete the columns you don't need before you paste. It opens in Excel and in Google Sheets (File, Import, Upload). There's also a header-only CSV that shows the paste layout.
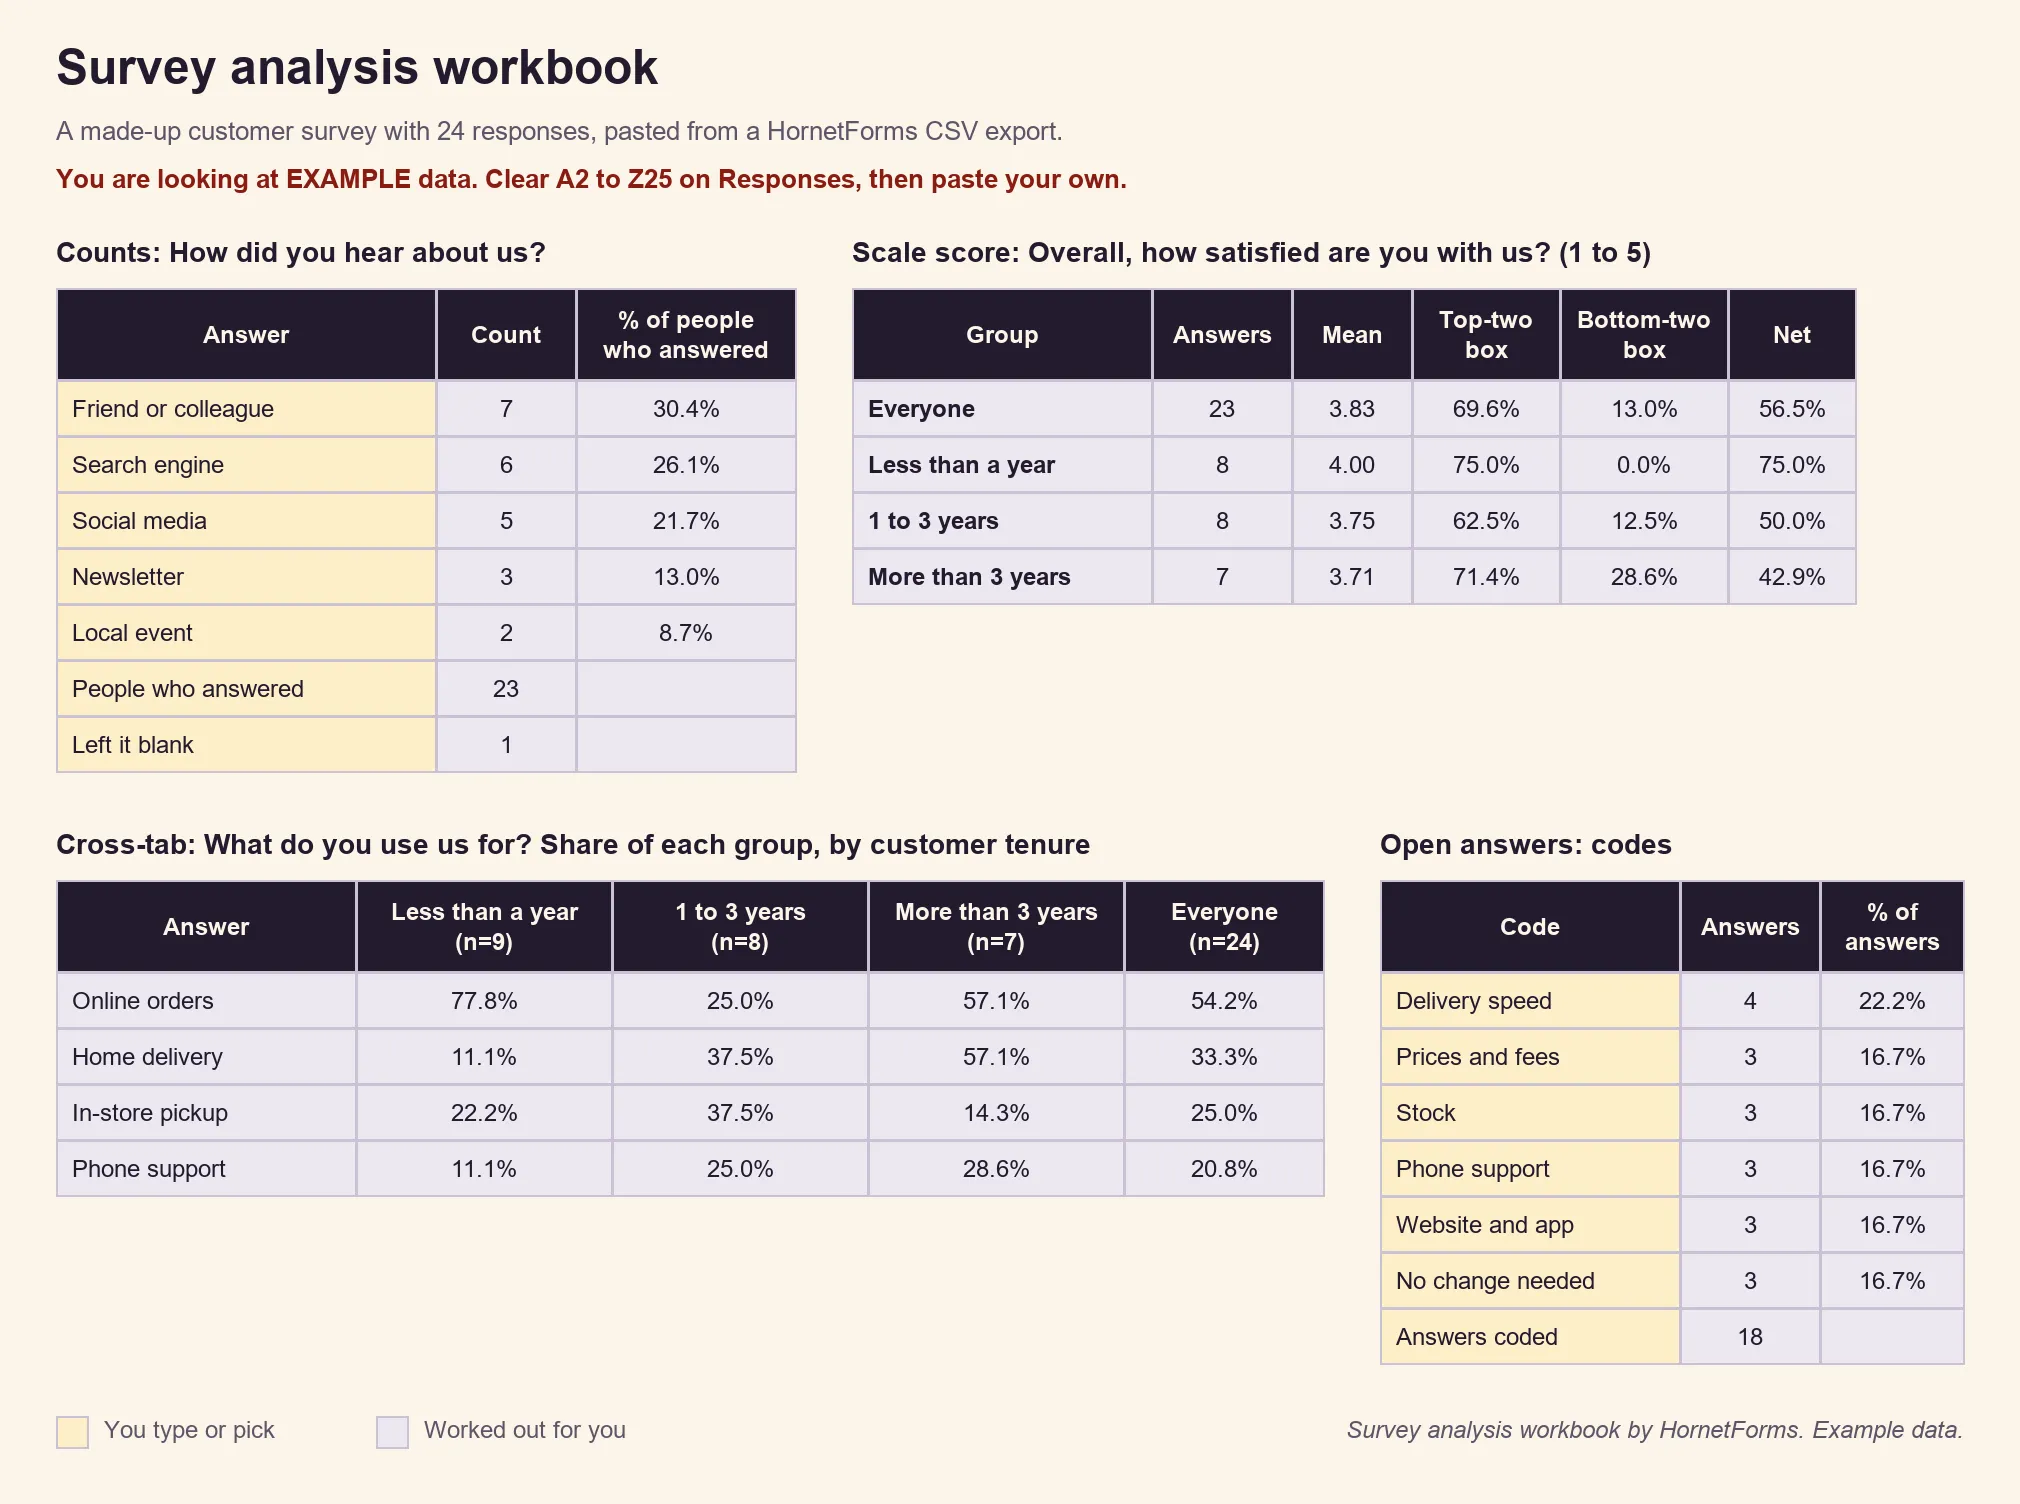
Example data only, invented for this guide.
Write a one-page survey results report#
Most people won't open your spreadsheet. Give them one page. The free survey results report template (Word) has five parts:
- About the survey: the purpose, who you asked and how, the dates it was open, and how many people answered.
- Key findings: three at most, each with the number behind it and how many answers it rests on.
- Charts: room for two, each with a title that says the finding.
- What we will do next: each action with an owner and a date.
- A check before you share: the exact question wording, the number behind every share, and who may be missing.
That last part comes from how professional survey researchers report. The American Association for Public Opinion Research (AAPOR) standard says: "Disclose the dates of data collection." It asks for "the exact wording and presentation" of the questions behind the results, and for "the unweighted sample size(s) on which one or more reported subgroup estimates are based" (AAPOR Disclosure Standards, accessed 28 October 2026). A customer survey doesn't need the full standard, but dates, wording and group sizes make a survey results report people can trust.
The template also comes as a printable PDF in US Letter and A4.
Or read the Summary tab first#
Before any spreadsheet, look inside HornetForms. The Responses page has a Summary tab with a first read of each question. It scores NPS and CSAT questions for you, and it shows each matrix (grid) question as a table of counts and shares. The CSAT score is the share of answers that are 4 or 5 on the five-point scale. The built-in analytics add views, starts, completions and roughly where people stop.
That's often enough for a quick update. When you need groups, coded comments or a report, export and analyze survey results with the steps above. To show one standout answer in full, download that response as a PDF, on every plan.
Coming from Google Forms? The steps are the same once your answers are in a sheet, and our Google Forms vs HornetForms comparison shows what changes. For your next survey, pick the right question types up front: closed questions for anything you plan to count, and one open question for the why.
Analyze your next survey in minutes#
Now you know how to analyze survey data without special software: export, clean, count, cross-tab, score, code, chart and report. If you're still planning the survey, start with our survey ideas, borrow from these questionnaire examples, or check whether you need a survey or a questionnaire. To get more answers next time, see our guide to survey response rates.
HornetForms gives you unlimited responses within fair use on every plan, CSV export and Google Sheets included. Sign up for free, send your survey, and paste the export into the workbook when the answers come in.