
On this page
You want to survey your customers, members or students, and someone asks the awkward question: how many answers do you need before the results mean anything? Twenty? Two hundred? Everyone?
This guide shows you how to calculate sample size for a survey, step by step. You'll learn the four numbers that drive the answer, the formula statisticians have used for decades, and the fix that makes it work for small groups. Then you get a ready survey sample size table and a free calculator that also tells you how many people to invite.
What survey sample size means#
Your population is everyone you want to learn about: all 2,000 members of your club, every customer who bought last year, all 200 people on staff. Your sample is the group who actually answers.
Survey sample size is the number of completed responses you need so that your results land close to what you'd get if everyone answered. Not the number of people you invite. Not the number who open the form. The number who finish it.
Why not just ask everyone? Sometimes you should, and we'll get to that. But for big groups, a well-chosen sample gets you close to the truth for far less effort. The trick is knowing how close is close enough, and that's what the formula answers.
The four inputs#
Every survey sample size calculation rests on four numbers. Three are choices you make. One is a fact about your group.
- Population size (N). How many people you could survey. If it's huge or you don't know (say, "everyone who visits our website"), treat it as very large.
- Confidence level. How sure you want to be that the true answer sits inside your range. 95% is the usual choice. 90% needs fewer responses; 99% needs more.
- Margin of error (e). How close you need to be. A 5% margin means that if 60% of your sample says yes, the true figure is probably between 55% and 65%.
- Expected share (p). Your best guess at the share of people who'll give a particular answer. If you have no idea, use 50%.
That last one looks odd, but it's the safe choice. Penn State's sampling course explains why: "Since p(1 - p) attains maximum at p = 1/2, a conservative estimate for sample size is" the version with 50% plugged in (Penn State STAT 506, Lesson 2.3, "Sample Size Needed for Estimating Proportion", accessed 28 October 2026). In plain words: 50% gives you the biggest sample size, so you can't come up short by guessing wrong.
Confidence level turns into a number called z before it goes into the formula. These come from the normal distribution. The NIST/SEMATECH e-Handbook of Statistical Methods lists them in a table it calls "critical values for the normal distribution" (NIST/SEMATECH e-Handbook, section 1.3.6.7.1, accessed 28 October 2026):
| Confidence level | z value | Excel or Google Sheets formula |
|---|---|---|
| 90% | 1.645 | =NORM.S.INV(0.95) |
| 95% | 1.960 | =NORM.S.INV(0.975) |
| 99% | 2.576 | =NORM.S.INV(0.995) |
How to calculate sample size for a survey, step by step#
The standard survey sample size formula comes from William Cochran's textbook Sampling Techniques (3rd edition, Wiley, 1977), and it's the same one taught in university sampling courses today. It starts with the sample size for a very large population, called n0:
n0 = z² × p × (1 − p) / e²
Here's how to calculate sample size for a survey of a very large group with the usual settings: 95% confidence (z = 1.96), a 5% margin of error (e = 0.05) and p = 0.5.
- Multiply z by itself: 1.96 × 1.96 = 3.8416.
- Multiply by p and (1 − p): 3.8416 × 0.5 × 0.5 = 0.9604.
- Multiply the margin of error by itself: 0.05 × 0.05 = 0.0025.
- Divide: 0.9604 / 0.0025 = 384.16.
- Round up: 385 completed responses.
Always round up, never down. Penn State's notes put it simply: "We will always round this up". Rounding down leaves you a fraction of a person short of the margin you asked for.
Good to know: that's where the famous "you need 384" figure comes from. It holds only for a very large population, 95% confidence, a 5% margin of error and p = 0.5. Change any one of those and the number changes. And strictly, 384.16 rounds up to 385.
Two patterns are worth remembering:
- Halving the margin of error roughly quadruples the sample. The formula squares the margin, so going from 5% to 2.5% takes you from 385 to about 1,537 responses.
- Higher confidence costs more. At 99% (z = 2.576), the same survey needs 664 responses instead of 385.
You can check the method against Penn State's own worked example. For a 3% margin at 95% confidence with p = 0.5, their notes calculate 1,067.11 and "round up to 1068". The free calculator gives the same 1,068.
Small populations: the finite population correction#
The 385 figure assumes your population is so large that taking 385 people out of it changes nothing. For a small group, that's not true. If your club has 2,000 members, 385 responses is almost a fifth of them, and you need fewer than the formula says.
The fix is the finite population correction:
n = n0 / (1 + (n0 − 1) / N)
Penn State's notes show why it matters. One example estimates an average across a population of 100 plots, and there, ignoring the correction nearly doubles the sample (75 instead of 43). The authors conclude that "N = 100 is not very large compared to n, so one should not ignore the finite population adjustment!" On the other hand, when they size a national poll, they note that "Since N is very large compared to n, finite population correction is not needed."
Here's the correction worked for that club with 2,000 members, at 95% confidence and a 5% margin:
- Start with n0 = 384.16 from the step-by-step above.
- Work out (n0 − 1) / N: 383.16 / 2,000 = 0.19158.
- Add one: 1.19158.
- Divide: 384.16 / 1.19158 = 322.4.
- Round up: 323 completed responses, not 385.
And for a team of 200 staff, at 90% confidence (z = 1.645) and a 5% margin:
- n0 = 1.645² × 0.5 × 0.5 / 0.05² = 2.706 × 0.25 / 0.0025 = 270.6.
- n = 270.6 / (1 + 269.6 / 200) = 270.6 / 2.348 = 115.2.
- Round up: 116 completed responses, more than half the team.
The smaller the group, the bigger the share of it you need. Below a few hundred people, the survey sample size gets close to everyone. That's a hint we'll come back to.
A ready survey sample size table#
Don't want to do the maths? This survey sample size table shows the completed responses you need at p = 0.5, rounded up, for common population sizes. "Very large" means no correction.
At 95% confidence
| Population size | Margin of error 3% | Margin of error 5% | Margin of error 10% |
|---|---|---|---|
| 100 | 92 | 80 | 50 |
| 200 | 169 | 132 | 66 |
| 500 | 341 | 218 | 81 |
| 1,000 | 517 | 278 | 88 |
| 2,000 | 697 | 323 | 92 |
| 5,000 | 880 | 357 | 95 |
| 10,000 | 965 | 370 | 96 |
| 100,000 | 1,056 | 383 | 96 |
| Very large | 1,068 | 385 | 97 |
At 90% confidence
| Population size | Margin of error 3% | Margin of error 5% | Margin of error 10% |
|---|---|---|---|
| 100 | 89 | 74 | 41 |
| 200 | 159 | 116 | 51 |
| 500 | 301 | 176 | 60 |
| 1,000 | 430 | 214 | 64 |
| 2,000 | 547 | 239 | 66 |
| 5,000 | 654 | 257 | 67 |
| 10,000 | 700 | 264 | 68 |
| 100,000 | 746 | 270 | 68 |
| Very large | 752 | 271 | 68 |
Look down any column and you'll notice something: past about 10,000 people, the number barely moves. A survey of a city and a survey of a country need almost the same sample. What drives the count is the margin of error you want, not how big the population is.
The full table, with 15 population sizes and margins of 2%, 3%, 4%, 5% and 10%, is in the free survey sample size table (CSV). Can't reach the number you need? Read the table the other way: find your population row and the column that matches the responses you can realistically get. That's the margin of error your survey supports.
From sample size to invitations#
The formula tells you how many completed responses you need. It doesn't tell you how many people to ask, because not everyone answers. For that, divide by your response rate:
invitations = sample size / your expected response rate
Use a rate from your own past surveys to the same kind of people, not a number from someone else's industry. Say your last member survey went to 1,000 people and 300 finished it. That's 30%. For the club that needs 323 responses:
- 323 / 0.30 = 1,076.7.
- Round up: invite 1,077 people.
If the answer is bigger than your whole population, invite everyone and accept a wider margin of error. The table above shows how wide.
Measuring and raising your survey response rate is a topic of its own. For sample size, all you need is an honest rate from your own last survey.
When the formula doesn't apply#
Cochran's formula is a tool for one job: estimating a share (like "62% would recommend us") from a random sample. It doesn't fit every survey.
- Small groups: ask everyone. If you have 80 people on staff or 40 students in a class, the table says you need nearly all of them anyway. Survey the whole group (a census) and skip the sampling maths.
- Interviews and open-ended research. If you're talking to 10 customers to understand a problem, you're not estimating a percentage. You're looking for reasons and patterns. Stop when new conversations stop teaching you anything new.
- Early product signals. Some founders read a quick score from a few dozen answers. The product market fit survey guide quotes Superhuman's founder, Rahul Vohra, who wrote that "you start to get directionally correct results around 40 respondents" (First Round Review, accessed 28 October 2026). Treat that as a direction, not a measurement.
- Scores rather than shares. An average rating or a net promoter score isn't a single share, so this formula only gives a rough guide. Our guide to how to calculate NPS covers what to watch when you have few answers.
- People who pick themselves. The formula assumes you chose people at random and most of them answered. If only the happiest or angriest customers reply, no sample size fixes that. A bigger pile of self-selected answers is still self-selected.
Good to know: you'll also see Slovin's formula, n = N / (1 + N × e²). It gives about the same answer as Cochran's formula with z set to 2 and p to 50%, and it has no way to choose your confidence level. Cochran's version with the correction lets you set all four inputs.
Not sure whether you're running a survey or a questionnaire in the first place? Our post on survey vs questionnaire untangles the two words.
Use the free sample size calculator#
The free survey sample size calculator (Excel) does all of the above in one place: a sample size calculator for surveys that works in Excel and Google Sheets. Type your population size, confidence level, margin of error and expected share in the yellow cells, and it shows:
- The z value (worked out with
NORM.S.INV, with the printed table value beside it as a check) - n0, the sample size before the correction
- n after the finite population correction
- Your survey sample size, rounded up
- The share of your population that is
- Invitations to send, once you type your own response rate
It also has the ready table for 95% and 90% confidence, a tab of z values and a tab that checks the sheet against the worked examples in this post and two from Penn State's notes. The sheet doesn't assume a response rate for you. It waits for yours.
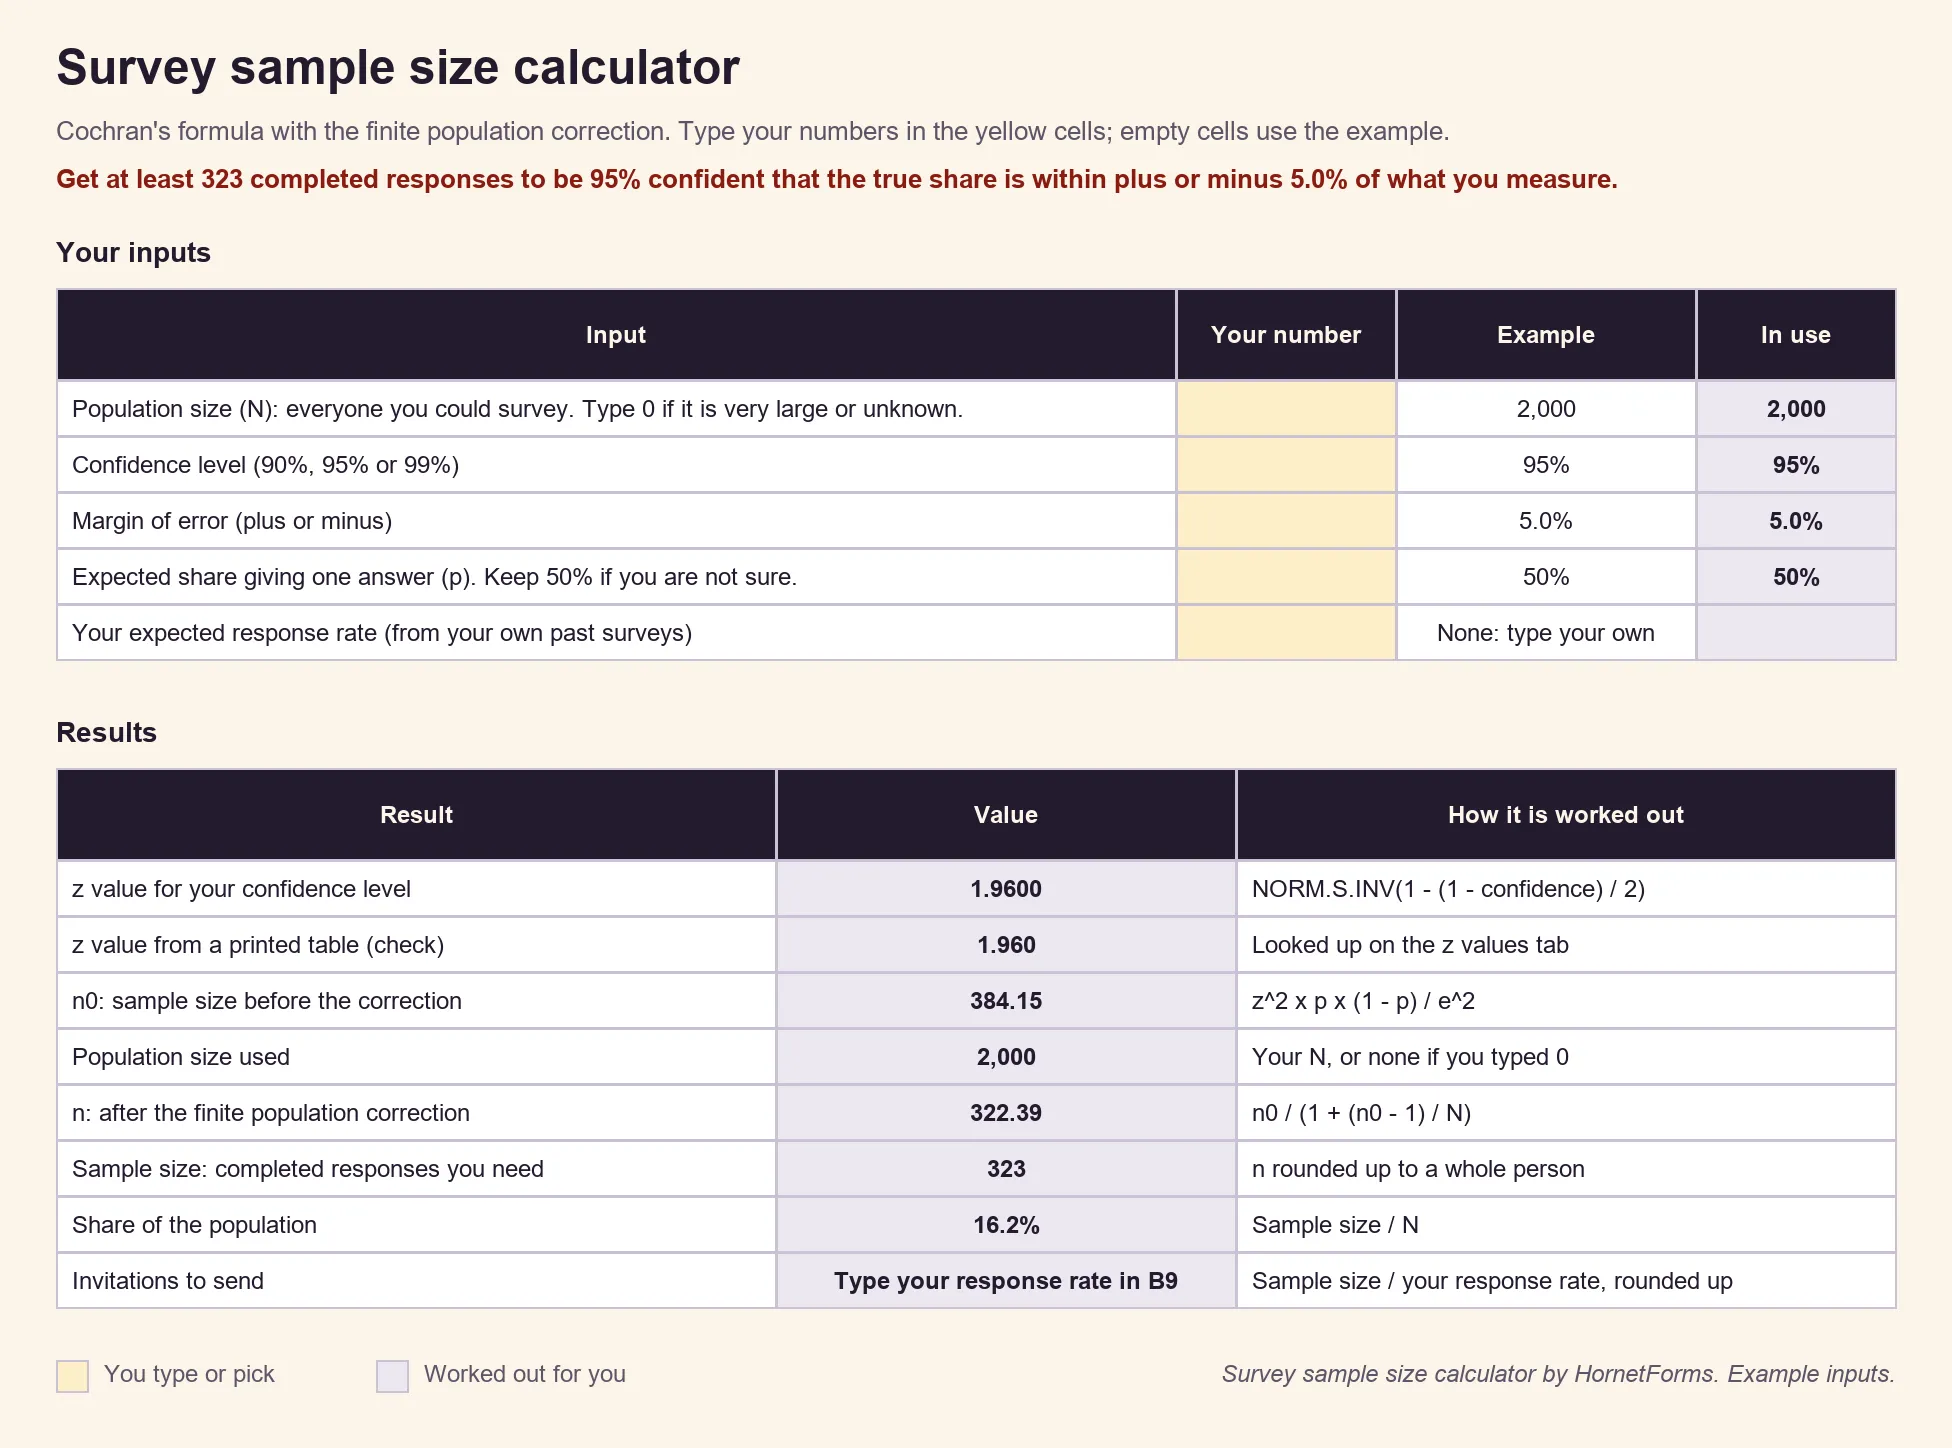
Example inputs only. Type your own numbers over them.
The sheet's n0 shows 384.15 rather than 384.16 because it uses the exact z (1.95996) instead of the rounded 1.96. Now and then that shifts a result by one person after rounding up. Either way, you're fine.
Collect your responses with HornetForms#
Once you know your number, you need a survey people will actually finish. Keep it short and clear. Our guide on how to write survey questions covers wording, and the 20+ question types post helps you pick the right format for each one.
A few HornetForms features help you hit a sample size target, on every plan:
- Built-in analytics show views, starts and completions, so you can see how close you are to your number while the survey runs.
- The Summary tab breaks down the answers to each question as they come in.
- A close date (a date and a time) ends the survey when your fieldwork window ends. You could set a response limit instead, but stopping at the first 323 answers lets early responders decide the result. A close date gives everyone you invited the same chance.
- QR codes for posters and handouts, if some of your population isn't on email.
- CSV export on every plan, and Excel export on Pro and Business (see the pricing page), for your own analysis. When you analyze survey data, the export is where it starts.
You also get unlimited responses within fair use, so a survey that does better than planned keeps collecting. If you've ever had a form stop mid-survey on another tool, our post on what happens when your form hits a response limit explains why that matters for sampling.
Work out your number, then send the survey#
Pick your confidence level and margin of error, count your population and keep p at 50% unless you know better. Then read your number from the table, or type it all into the calculator and get your invitations count too. HornetForms is free forever on the Free plan, and there's more on the features page. Sign up for free and build the survey your sample size deserves.