
On this page
You asked customers how likely they are to recommend you, and now you have a column of numbers from 0 to 10. What's the score? This guide shows you how to calculate NPS, the net promoter score, by hand, in a spreadsheet and with a free calculator.
You'll see where the question comes from, how to sort every answer into one of three groups, and the formula worked through three examples. Then come the Excel and Google Sheets formulas, how to read the follow-up answers, and how many answers you need before the number means much. The free NPS calculator, a one-page cheat sheet and the example data are all linked below.
The NPS question and the 0 to 10 scale#
NPS comes from Fred Reichheld's 2003 Harvard Business Review article, "The One Number You Need to Grow". His sidebar, "A Net-Promoter Primer", gives the exact question: "How likely is it that you would recommend [brand or company X] to a friend or colleague?" (Reichheld, Harvard Business Review, December 2003, accessed 28 October 2026).
The scale matters as much as the wording. Reichheld writes: "It's critical to provide a consistent scale for responses that range from zero to ten, where zero means not at all likely, five means neutral, and ten means extremely likely."
So the rules are simple:
- Eleven points, 0 to 10. Not 1 to 10, and not five stars.
- Label the ends. "Not at all likely" at 0 and "Extremely likely" at 10 is the classic pair.
- Keep it the same every time. Change the wording or the scale and you can't compare this quarter with the last one.
He also warns against long surveys: "Resist the urge to let survey questions multiply; more questions diminish response rates along with the reliability of your sample." One question, plus one open follow-up, is the whole survey.
Promoters, passives and detractors#
Every answer lands in one of three groups. In Reichheld's words: "Calculate the percentage of customers who respond with nine or ten (promoters) and the percentage who respond with zero through six (detractors)." He calls the people in between, who give 7 or 8, "passively satisfied". Most guides shorten that to passives.
| Group | Score | What it usually means |
|---|---|---|
| Promoters | 9 or 10 | Happy enough to tell friends about you |
| Passives | 7 or 8 | Satisfied, but not telling anyone |
| Detractors | 0 to 6 | Unhappy enough to warn people off |
Notice how wide the detractor band is. A 6 feels like a pass mark, but when you calculate NPS it counts the same as a 0. That's on purpose: the score rewards people who would actually recommend you, not people who are fine.
How to calculate NPS: the formula, worked through three examples#
Here's how to calculate NPS from a set of answers, in Reichheld's words: "Subtract the percentage of detractors from the percentage of promoters to arrive at your net-promoter score."
As a formula:
NPS = % promoters - % detractors

% promoters  = promoters / all answers x 100
% detractors = detractors / all answers x 100
Passives count in "all answers" but not in the subtraction. So the score runs from -100 (everyone is a detractor) to 100 (everyone is a promoter). Write it as a plain number, like 25, not 25%.
Example 1: 20 answers, NPS 25#
A small batch of 20 answers came in:
9, 10, 8, 6, 9, 7, 10, 9, 8, 3, 9, 7, 10, 8, 9, 5, 7, 8, 0, 9
- Count the promoters (9 or 10): six 9s and three 10s make nine.
- Count the passives (7 or 8): seven.
- Count the detractors (0 to 6): the 6, 5, 3 and 0 make four.
- Turn them into percentages: 9 / 20 = 45% promoters, 4 / 20 = 20% detractors.
- Subtract: 45 - 20 = NPS 25.
Example 2: 37 answers, NPS 13.5#
Real numbers rarely divide this neatly. Say 37 people answered: 15 promoters, 12 passives and 10 detractors.
- % promoters: 15 / 37 = 40.5%
- % detractors: 10 / 37 = 27.0%
- NPS: 40.5 - 27.0 = 13.5
Rounded percentages can leave you a decimal out, so work from the counts when you can: (15 - 10) / 37 x 100 = 13.51. Report it as 13.5 or 14, as long as you round the same way every time.
Example 3: 120 answers, NPS -20#
A product had a rough quarter. Of 120 answers, 30 were promoters, 36 were passives and 54 were detractors.
- % promoters: 30 / 120 = 25%
- % detractors: 54 / 120 = 45%
- NPS: 25 - 45 = -20
A negative score just means you have more detractors than promoters. It's a signal to read the comments, not a reason to panic.
| Example | Promoters | Passives | Detractors | NPS |
|---|---|---|---|---|
| 1: 20 answers | 9 (45%) | 7 (35%) | 4 (20%) | 25 |
| 2: 37 answers | 15 (40.5%) | 12 (32.4%) | 10 (27.0%) | 13.5 |
| 3: 120 answers | 30 (25%) | 36 (30%) | 54 (45%) | -20 |
Same score, different story#
Two very different groups can share one score. In 100 answers, 30 promoters, 70 passives and no detractors make an NPS of 30. So do 60 promoters, 10 passives and 30 detractors. The first group is calm. The second loves you or can't stand you. Always look at the three percentages next to the score.
Calculate NPS in Excel or Google Sheets#
If your scores sit in one column, here's how to calculate NPS with three formulas. These assume the answers are in B2 to B201 and every cell holds a whole number from 0 to 10:
Promoters:   =COUNTIF(B2:B201,">=9")
Detractors:  =COUNTIF(B2:B201,"<=6")
All answers: =COUNT(B2:B201)
NPS:         =(COUNTIF(B2:B201,">=9")-COUNTIF(B2:B201,"<=6"))/COUNT(B2:B201)*100
They work the same in Excel and Google Sheets. Two things can trip them up: a stray value like 11 or "N/A" in the column, and an empty column, which gives you a #DIV/0! error.
The free NPS calculator (Excel) handles both. Paste your scores into column A, one per row, with room for 1,000 answers. It shows:
- The number of scores counted, plus a separate count of anything that isn't a whole number from 0 to 10 (blank cells are skipped)
- Promoters, passives and detractors, as counts and percentages
- The NPS, and a table of how many people gave each score
- Two bar charts: the three groups, and the spread from 0 to 10
Each row also shows its group, so you can spot the odd value. With no scores pasted, the results stay blank instead of showing an error. Only have the counts? The From counts tab takes promoters, passives and detractors on one row, with all three examples above filled in.
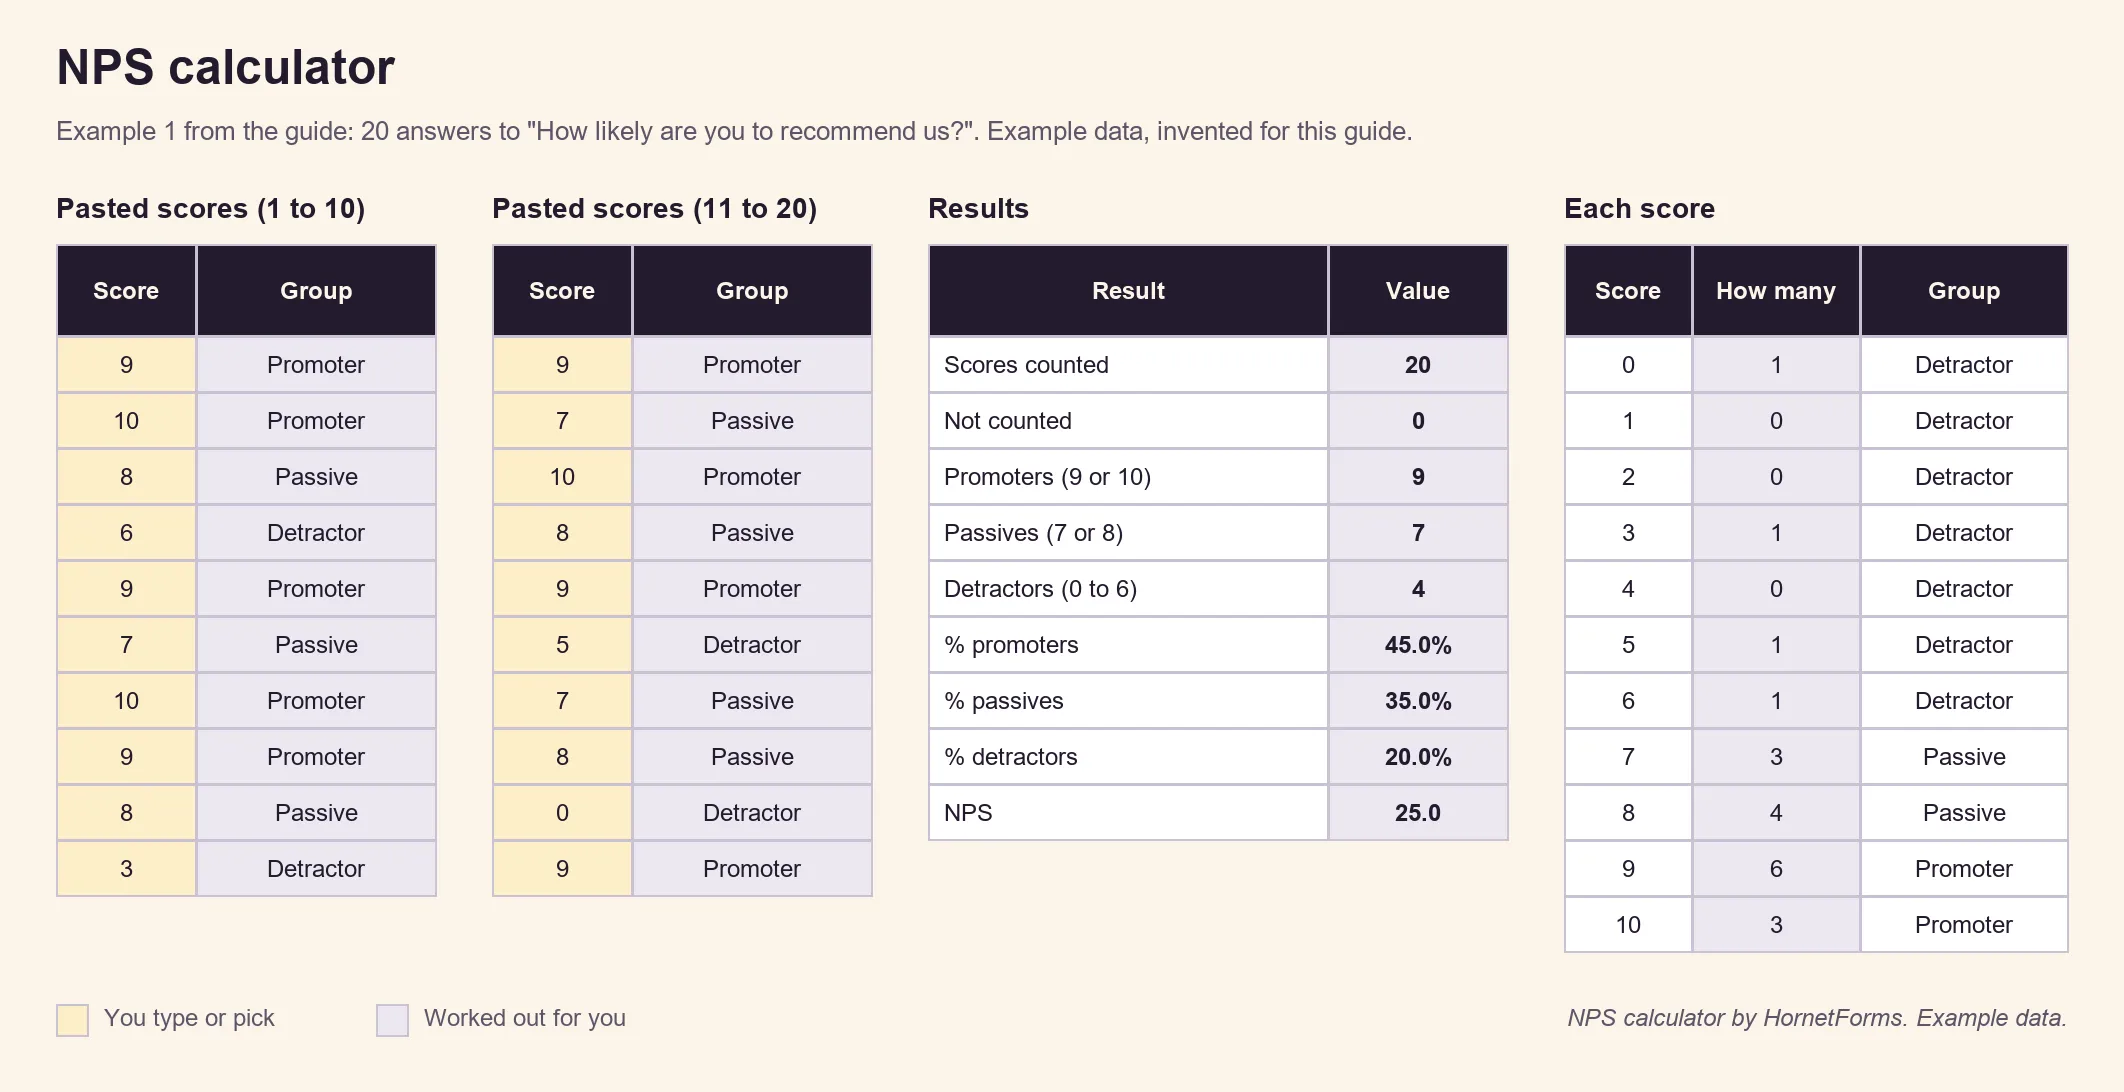
Example data only, invented for this guide.
We checked the calculator against all three examples in this guide, plus blank cells and stray values, and it matches the hand calculation each time. The example scores as a CSV are there if you'd rather build your own sheet. For the wall above your desk, there's the one-page NPS cheat sheet (PDF, US Letter), also in A4.
Can you calculate NPS on a 1 to 5 scale?#
People search for this a lot, and the honest answer is no. The groups are defined on a 0 to 10 scale, so a five-point answer has no fair place to land. Is a 4 out of 5 a promoter or a passive? Any rule you pick is your own invention, and the result won't compare with anyone's NPS, including your own past scores. If you already run a five-point satisfaction question, keep it and report it as its own score. Then add the 0 to 10 question for NPS. Our list of customer satisfaction survey questions has good five-point questions to keep.
Read the follow-up answers, not just the score#
The number tells you how many people are unhappy. It doesn't tell you why. Reichheld says as much: "Follow-up questions can help unearth the reasons for customers' feelings and point to profitable remedies. But such questions should be tailored to the three categories of customers."
In practice, that means one open question after the score, worded for the group:
- Detractors (0 to 6): "What could we do better?" or "What let you down?"
- Passives (7 or 8): "What would make it a 10?"
- Promoters (9 or 10): "What do you love about us?"
Then read every detractor comment and sort them into a few themes, like price, bugs or slow support. Count the themes: the biggest one is your next fix. Promoter comments tell you what to protect. For the full method, from cleaning the data to charts, see how to analyze survey data.
Our guide to logic, piping and calculations shows how to make a follow-up appear only for the right scores. For more on picking the right question for each job, see every question type and when to use it.
Sample size and how often to ask#
Knowing how to calculate NPS is the easy part. Knowing when it means something is harder, because the score swings a lot when few people answer. With 20 answers, each person is 5% of the total. If one detractor becomes a promoter, the promoter share goes up by 5 points and the detractor share drops by 5, so the NPS jumps by 10. With 200 answers, the same change moves it by one. Our guide to survey sample size shows how many answers you need for a steadier number.
So before you celebrate a rise or panic about a drop:
- Check how many people answered. A 15-point change in 20 answers can be three people.
- Compare like with like. Same question, same scale, same kind of customer, same point in their journey.
- Compare with yourself first. Your last quarter is a fairer yardstick than another company's score, which may come from a different question, audience or year.
How often to ask depends on how often people deal with you. Ask after a key moment, like a purchase or the end of onboarding, or send one survey a quarter. You can also send the NPS question as an email survey, so people answer from their inbox. Just don't ask the same person every week, or the answers dry up.
Run the survey with the NPS preset#
In HornetForms, NPS is a preset on the linear scale question: it sets the 0 to 10 scale for you, and you can label the ends. The Summary tab and the built-in analytics score it for you on every plan, splitting answers into promoters, passives and detractors and working out the NPS. So you only need the calculator when you want your own charts or a mix of sources.
The quickest start is the Net Promoter Score template, which has three questions:
- "How likely are you to recommend us to a friend?", with the NPS preset, from "Not likely" to "Very likely"
- "What could we do better?", shown for scores of 6 or less
- "What do you love about us?", shown for scores of 9 or more
The template page is at forms.hornetforms.com/templates/nps-survey. Its Use this template button takes you through sign-up and opens your own copy. Want the passives' view too? Change the first follow-up's rule from "is at most 6" to "is at most 8".
A few more things help:
- Tag where answers come from. Add a hidden field like
planand put its value in the link, so you can compare segments. The post-event survey questions guide uses the same trick with aneventfield. - Catch bad scores early. You can turn on an email to yourself for each new response, or send every response to Slack, Discord, Google Sheets or Notion. Our tour of where your form responses can go covers each one.
- Export for the calculator. CSV export works on every plan, and Excel export comes with Pro and Business (see the pricing page).
Asking people why they're leaving? Pair NPS with our cancellation survey template. It asks for the main reason and shows a follow-up for four of them, such as the price that would have worked or the feature they missed.
Try it on your next survey#
Ask one question on a 0 to 10 scale, sort the answers into three groups and subtract. That's how to calculate NPS, whether you do it by hand, with a COUNTIF or in the free calculator. Then spend more time on the comments than on the number. The features page shows what else the form builder does. Sign up for free and send your first NPS survey this week.
Net Promoter®, NPS® and Net Promoter System® are registered trademarks of Bain & Company, Inc., NICE Systems, Inc., and Fred Reichheld. Net Promoter Score℠ is a service mark of Bain & Company, Inc., NICE Systems, Inc., and Fred Reichheld.